
Measuring the carbon footprint of Rubenshuis
The challenge

Seeing the full climate picture across a historic site

Impact Area: Public & Social

Rubenshuis, the Antwerp home and studio of Peter Paul Rubens, wanted more than a single snapshot of its emissions. The ambition was to understand its carbon footprint over time and across its whole operations, so that climate action could be steered by evidence rather than assumption, and progress could be shown credibly.

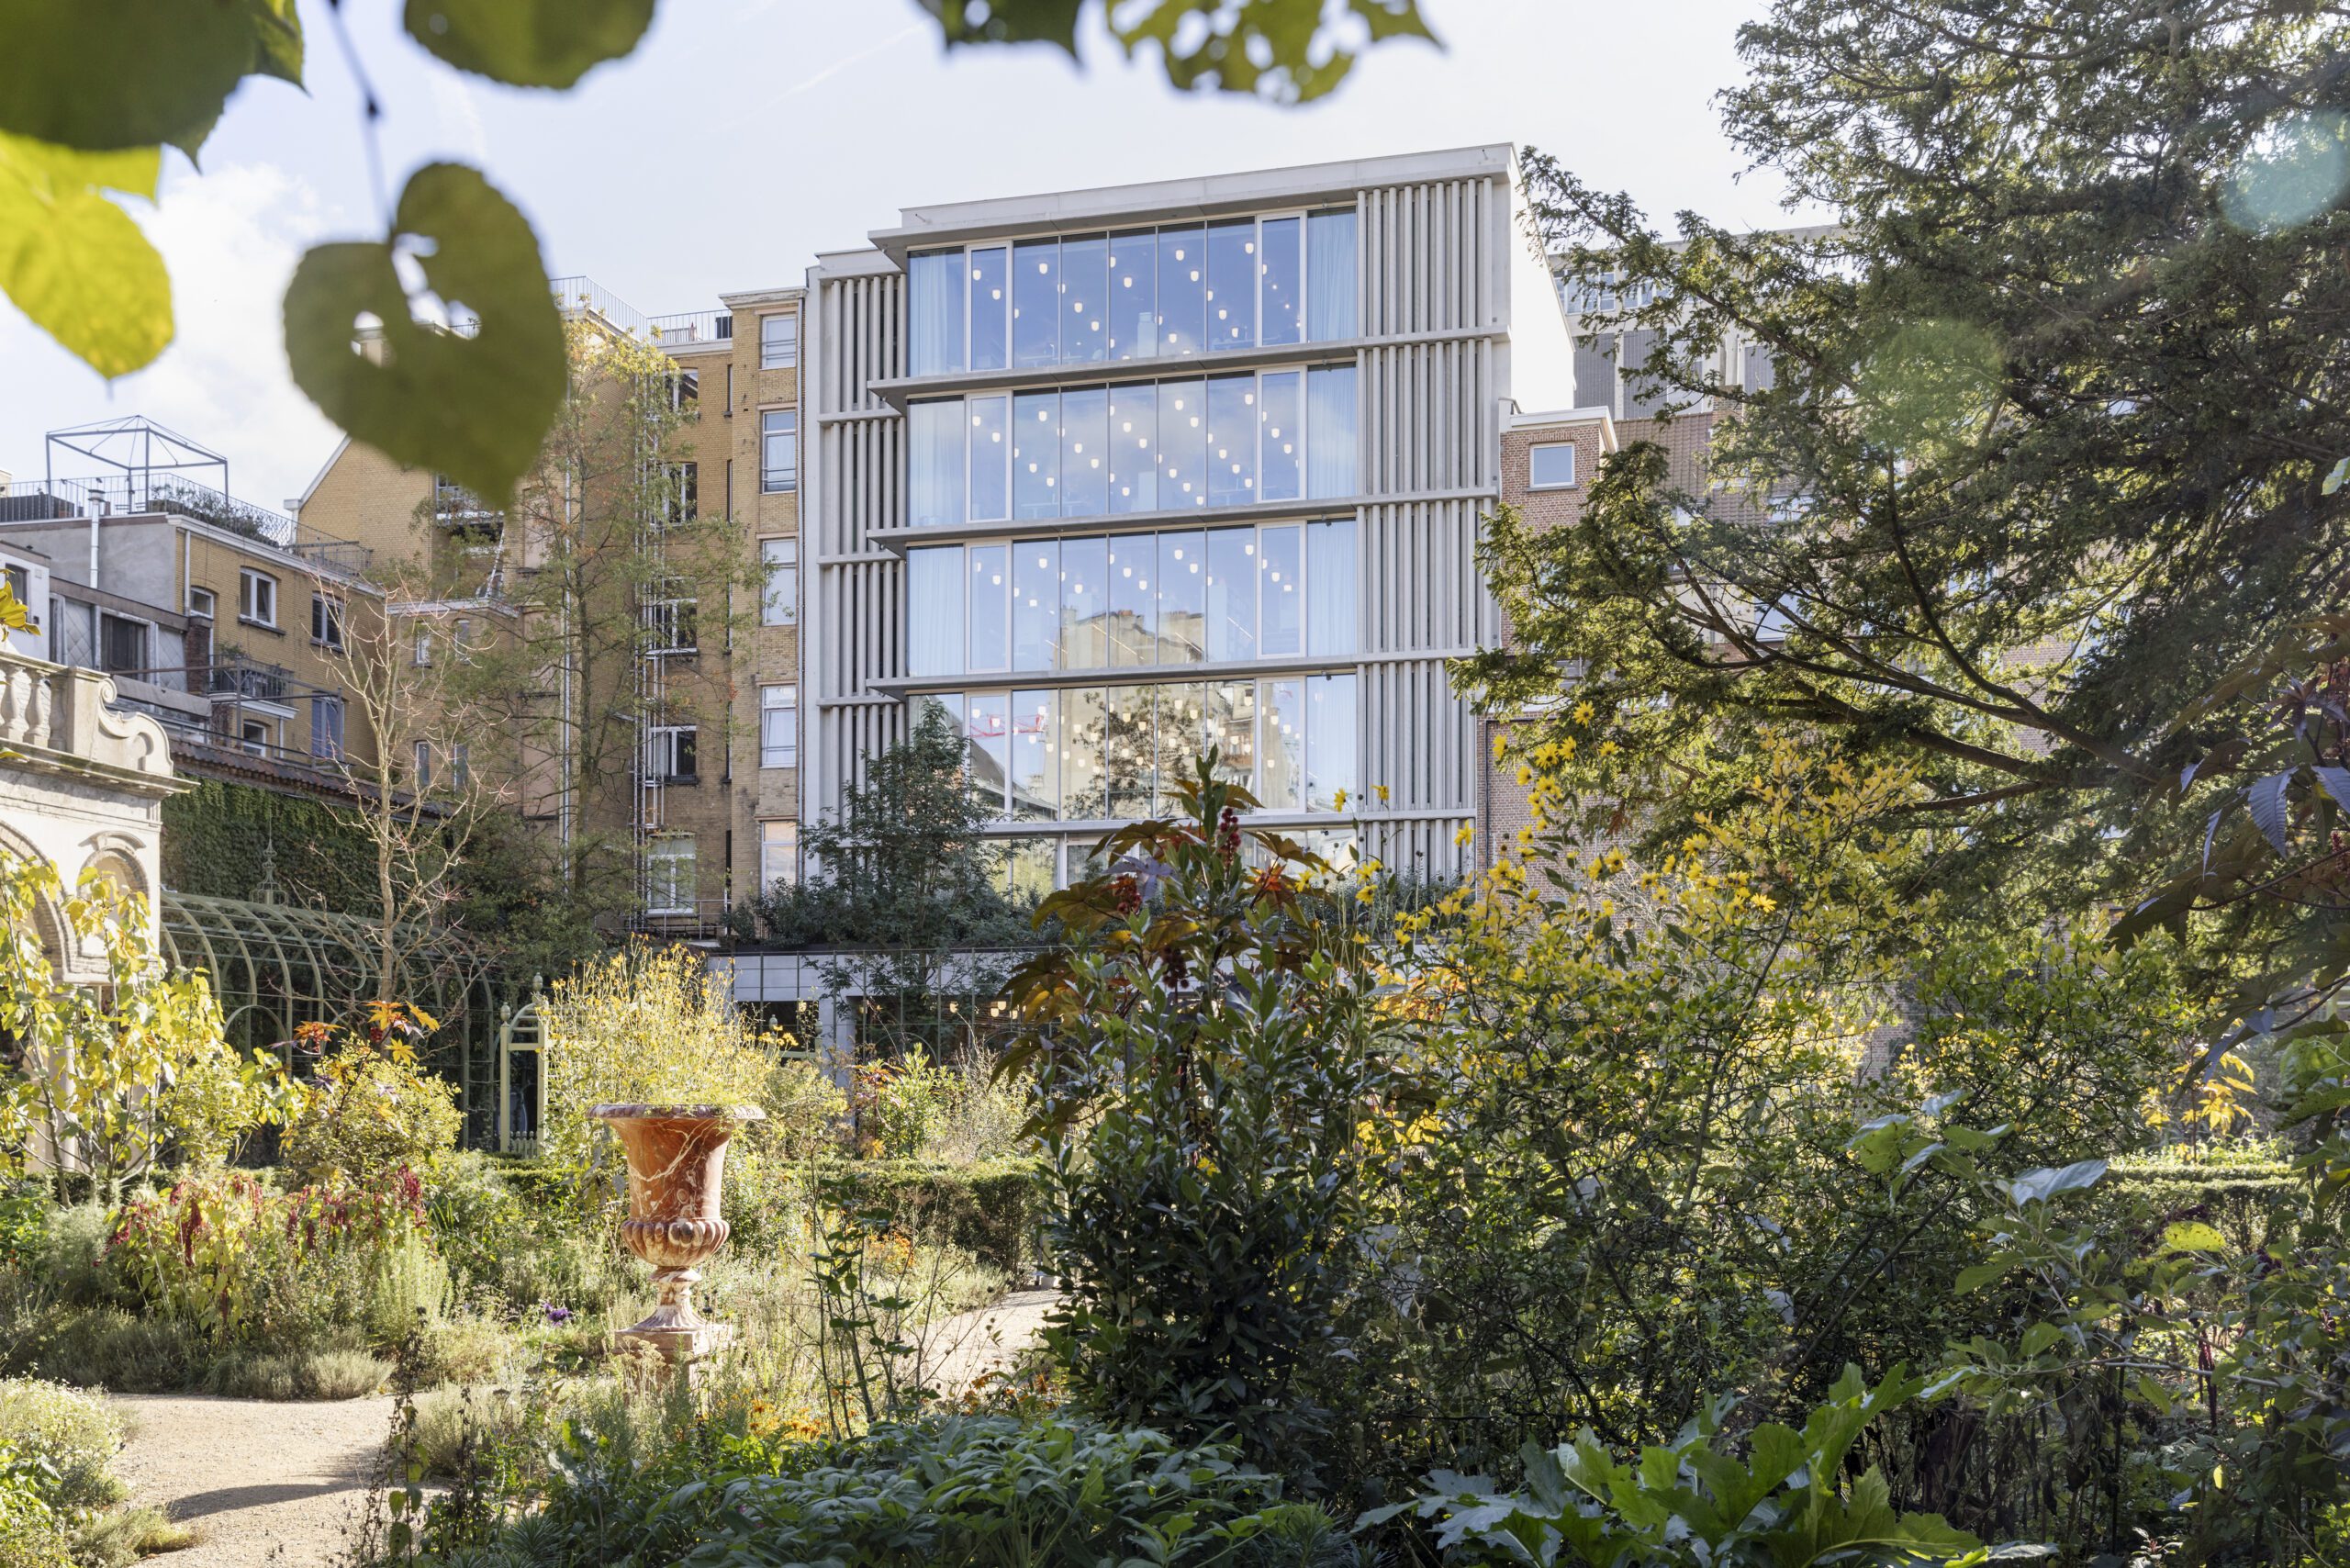
But Rubenshuis is not one building with one activity: it spans the historic house, the Rubenianum research institute, and a newer visitor Experience Center, each with its own energy use and rhythm. Its impact also extends well beyond the front door, into the specialist transport of artworks, the goods and services it purchases, the waste it produces, and the many visitors who travel to experience it. The challenge was to bring all of that together into one consistent, multi-year, standards-based view.

Our services

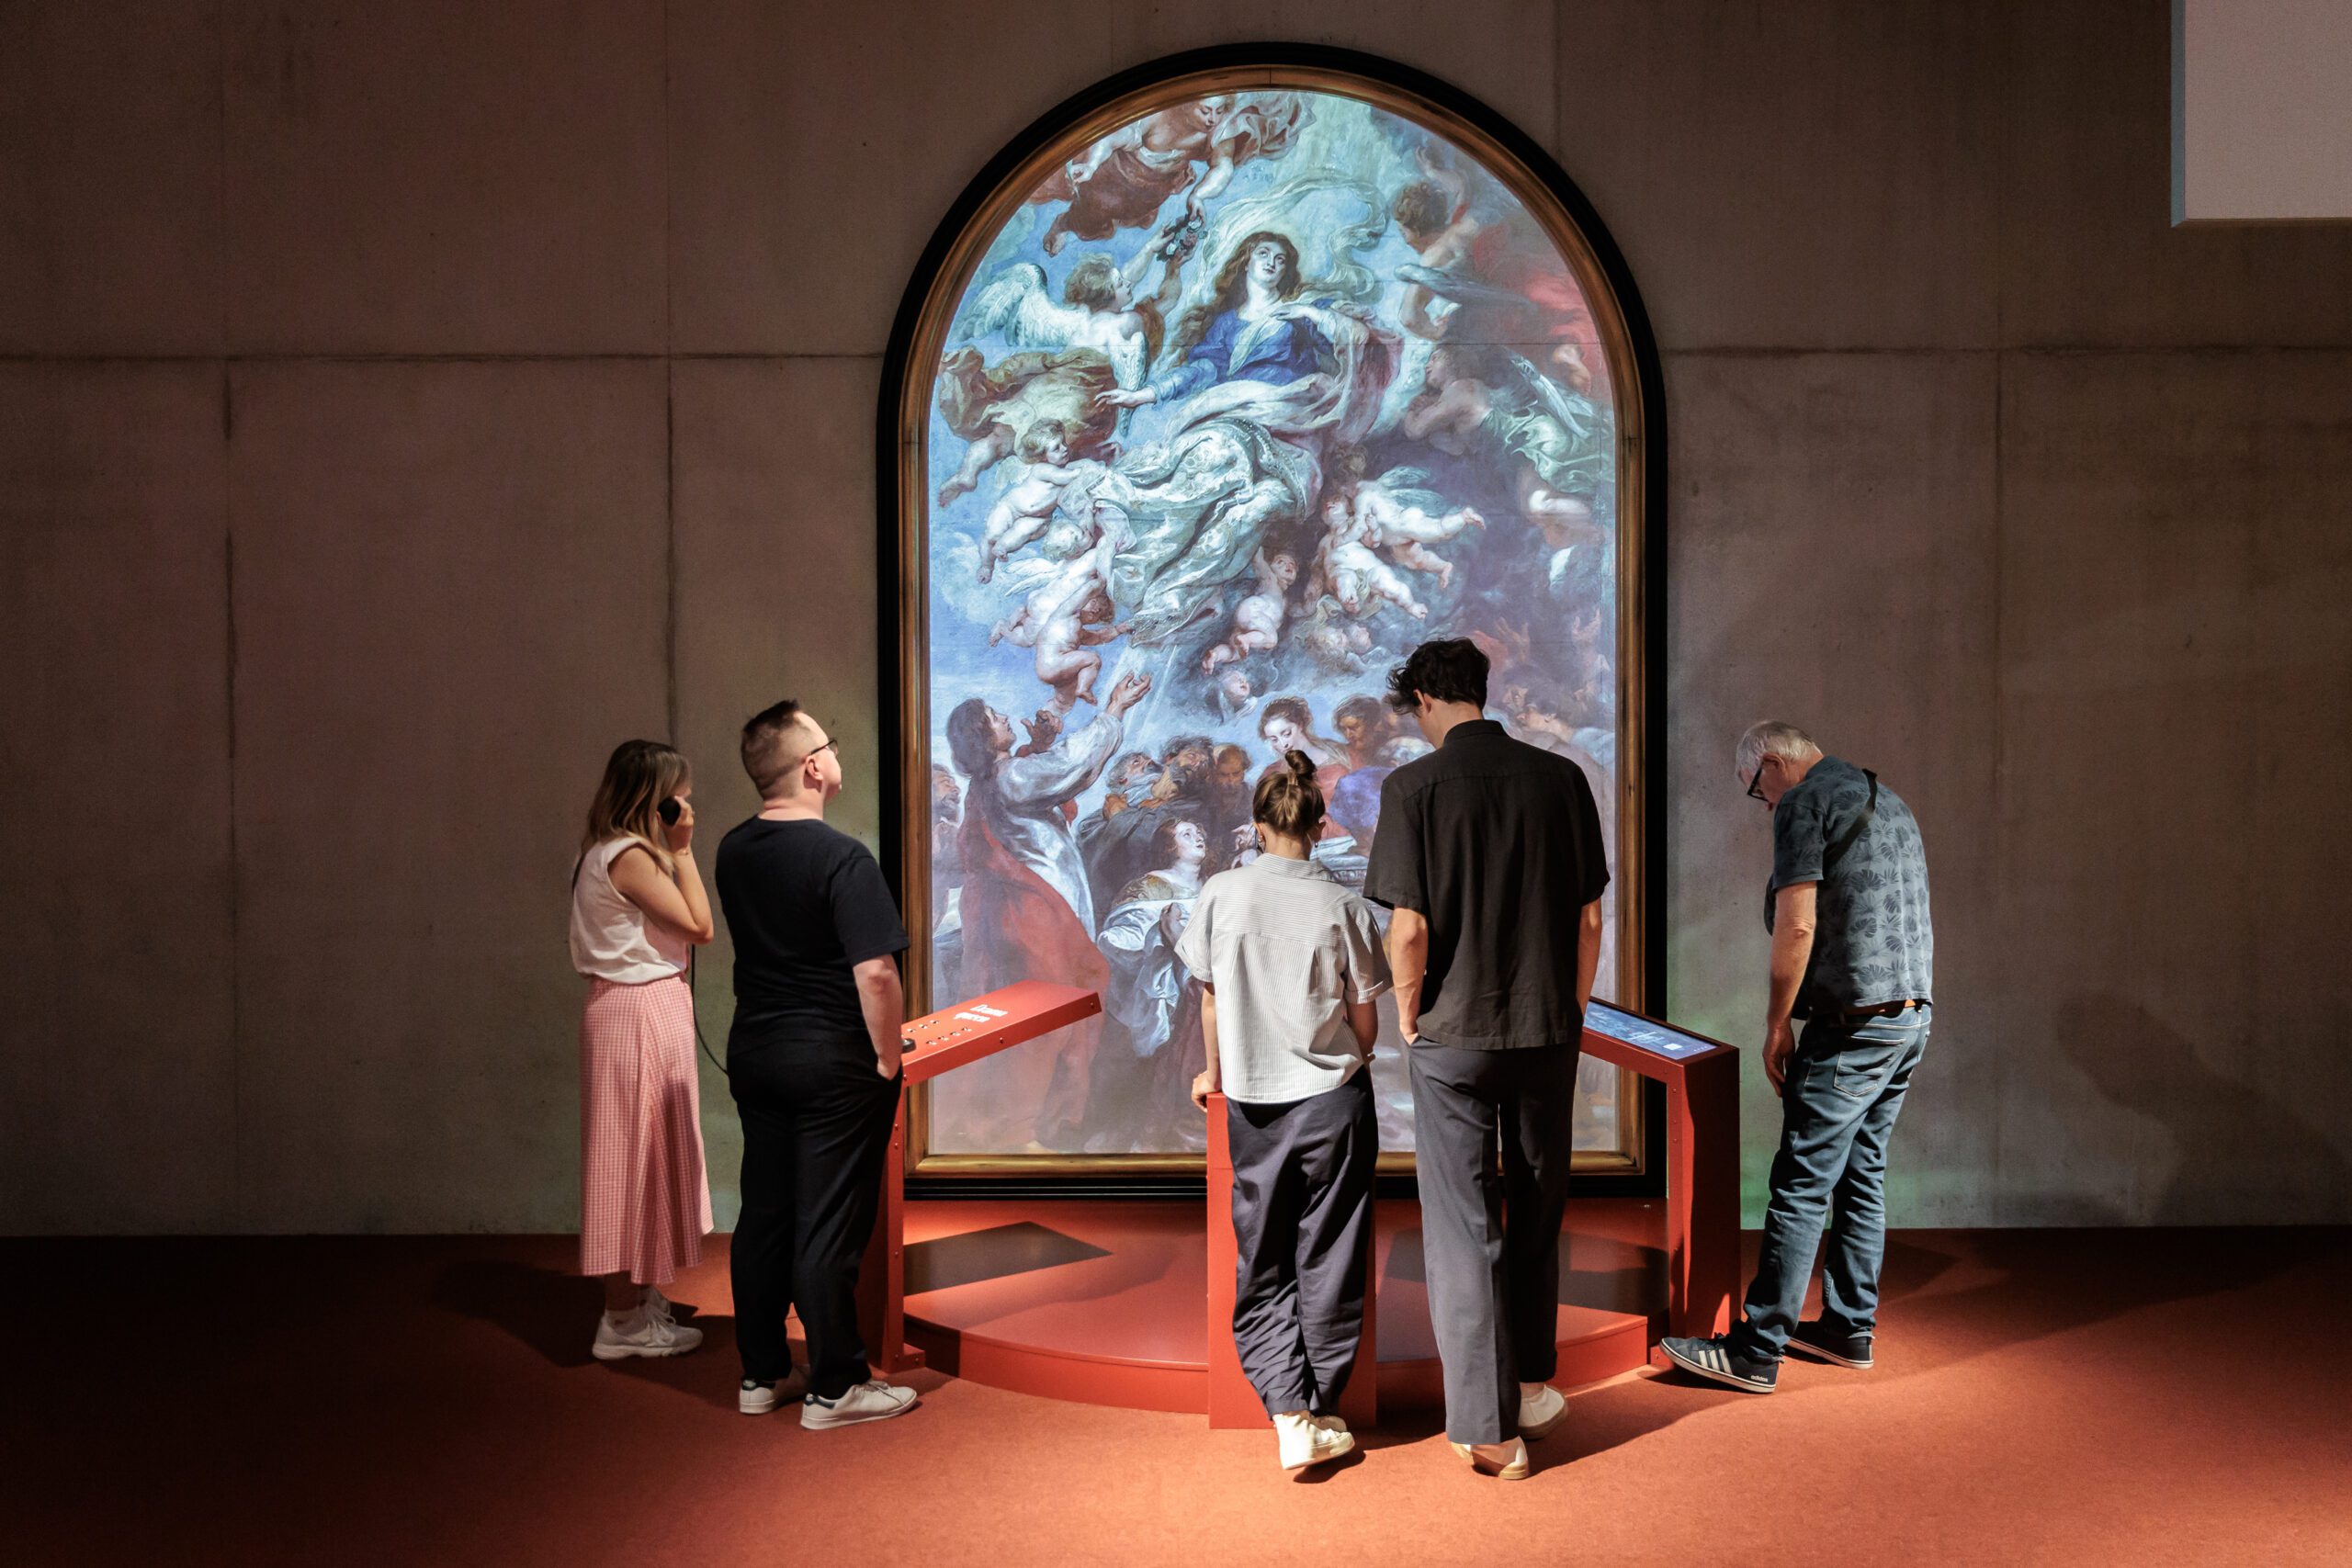
Picture by Ans Brys
About Rubenshuis

The Rubenshuis is the place where Peter Paul Rubens, one of the most famous Baroque artists of the 17th century, lived and worked and where he welcomed visitors both professionally and privately.  Four centuries later, this wonderful museum still does exactly the same thing

Our approach

Building a multi-year footprint, scope by scope

We calculated Rubenshuis’s carbon footprint in line with the GHG Protocol, the international standard for greenhouse gas accounting, under an operational-control boundary. Rather than measuring a single year in isolation, we built a picture that holds up over time and across every part of the organization. This is how we approached it:

  • A trend, not a snapshot

    We reconstructed direct emissions across several years and progressively built out the value-chain picture, so Rubenshuis can see the direction of travel rather than an isolated figure. The footprint covers the historic house, the Rubenianum and the Experience Center together, giving a complete view of an organization that has grown and changed over the period.

  • Full coverage across all three scopes

    We accounted for direct emissions from on-site heating, indirect emissions from purchased electricity, and the wider set of indirect emissions across the value chain. Where Rubenshuis already sources green electricity, we reflected that in the market-based result while still tracking the underlying grid impact, so the organization keeps an honest view of its real energy dependence rather than letting a green contract hide it.

  • Transparent, museum-specific emission factors, sharpened with suppliers

    Every activity was matched to a documented, well-referenced emission factor, with the nuances of a museum built in, from the higher impact of specialist, climate-controlled art transport to the more everyday footprint of catering, printing and even digital tools. For the most material purchases, we engaged suppliers to replace broad spend-based estimates with more accurate data where it existed.

  • Modelling the emissions of getting visitors through the door

    A significant share of a museum’s impact comes from visitor travel, even though Rubenshuis never pays for it directly. Using visitor-origin data, we modelled this downstream transport with carefully reasoned assumptions about distance, likely transport mode, and how much of each journey could reasonably be attributed to a visit.

Picture by Ans Brys
The result

A more complete picture, and a more honest one

The multi-year view surfaced an insight that a single year would have hidden. Through better energy and heating performance, Rubenshuis’s direct emissions have followed a clear downward trend over the period. At the same time, the organization’s measured total grew, not because it became less sustainable, but because the assessment boundary widened to capture the value chain and visitor travel that a narrower footprint would simply have left out.

That is exactly the point. Rubenshuis now has a consistent, standards-based dataset that shows both real progress on the emissions it controls directly and an honest account of the larger, indirect impacts it influences. It reveals where impact now concentrates, from purchased goods and upstream transport to visitor travel, and turns that into a focused basis for action.

Just as importantly, Rubenshuis gained a repeatable measurement method and a supplier-engagement process that will keep improving data quality, and a credible foundation to communicate its climate progress year after year.

Schedule a call 20min

  • Company intros
  • Discuss needs
  • Explain our vision and approach

Other Cases

IMS

Helping 9 organizations (Caceis, Novotel, European Investment Bank, ...) on their nature journey

Inspiring and engaging 9 organisations around a common framework for Nature

FOMU

Measuring the carbon footprint of the FOMU

Building a credible GHG Protocol baseline so Antwerp’s photography museum can track and reduce its climate impact year on year.

back to: Cases